UNMC Dashboard
Project Overview
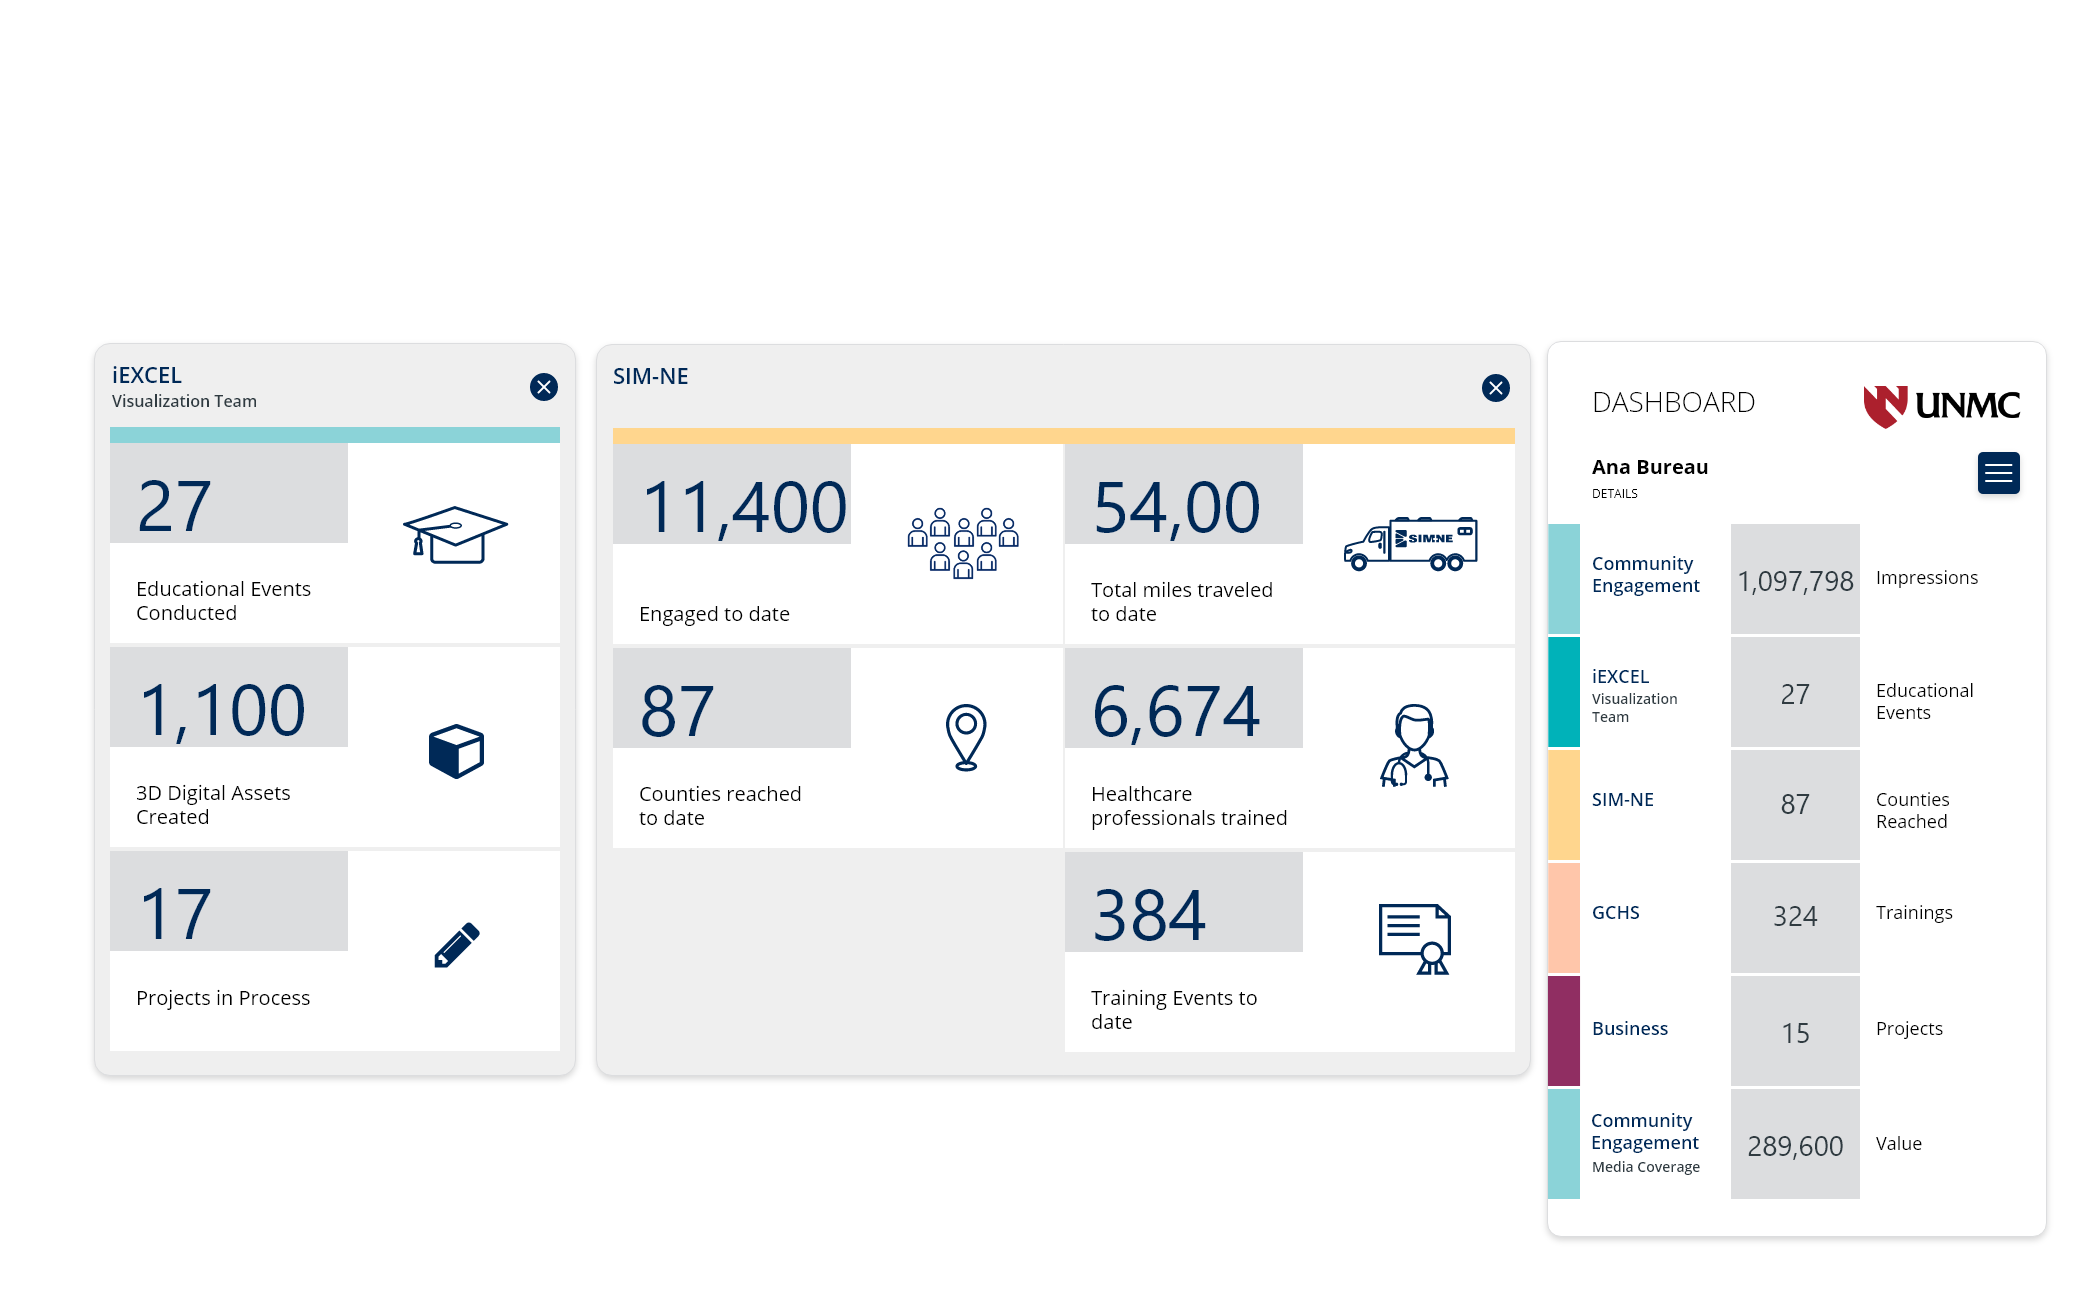
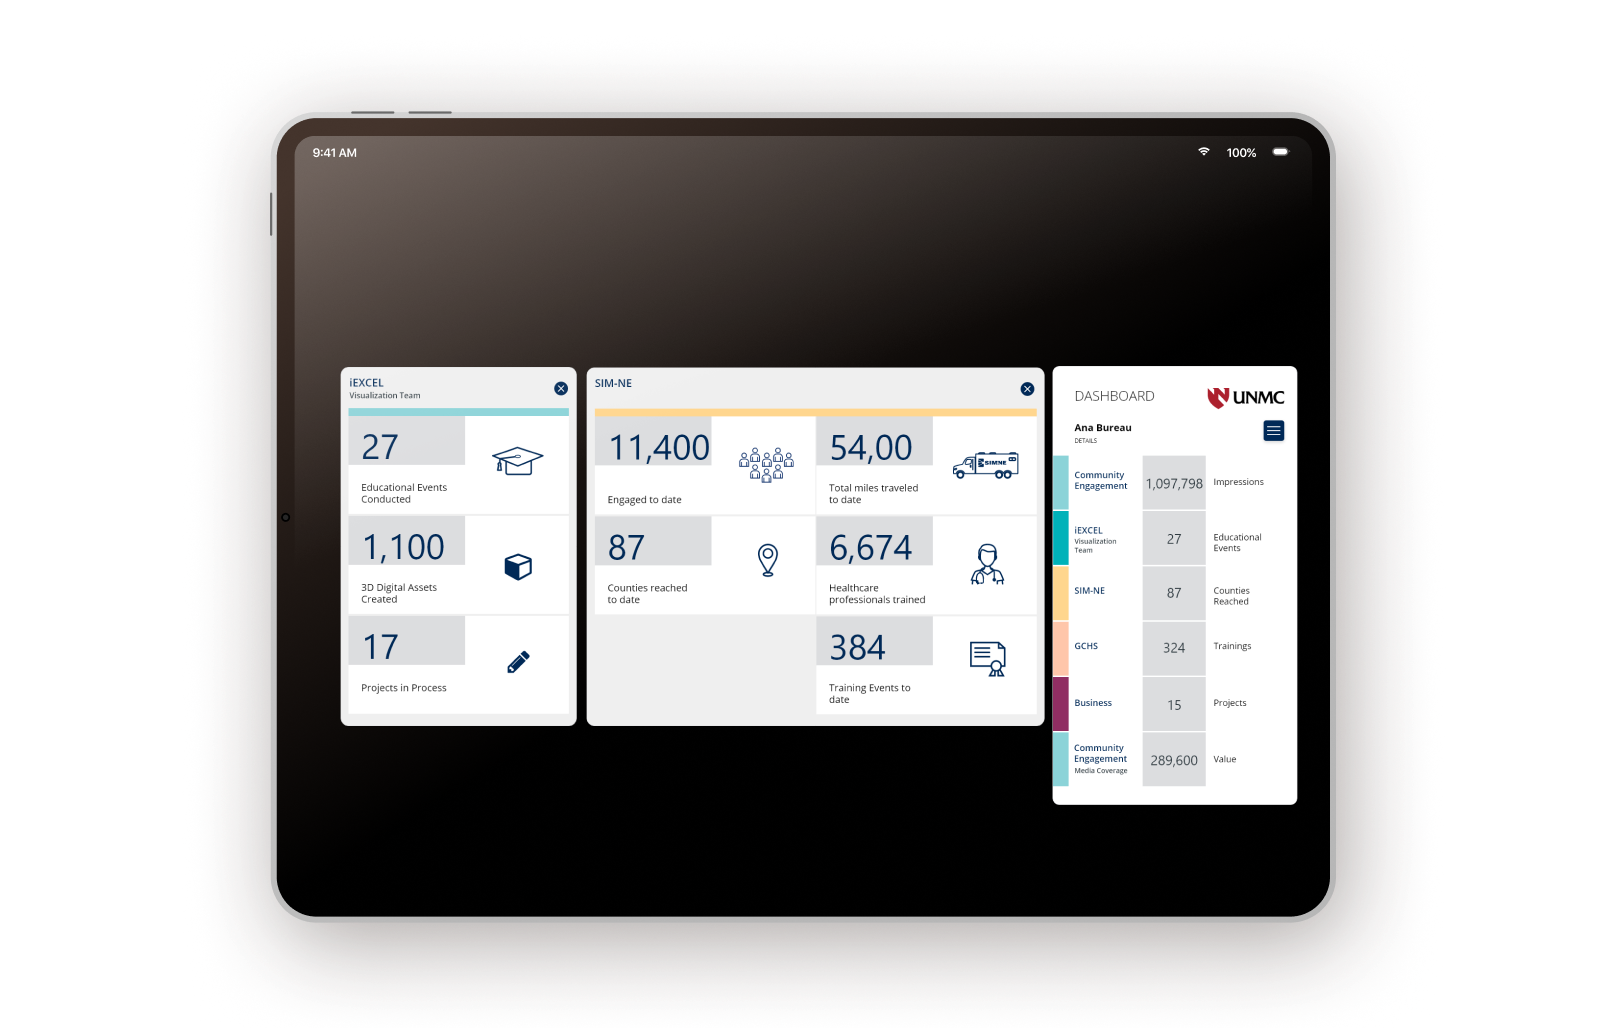
The University of Nebraska Medical Center is renowned for health sciences education and innovative health research. UNMC consists of 6 Colleges and two degree-granting institutes. UNMC was looking for a dashboard desktop app that displays data from different departments and Labs.
As a UI/UX designer, I undertook the challenge of creating a dashboard desktop application for the University of Nebraska Medical Center (UNMC). The objective was to develop a user-friendly interface to collate and present data from various departments and laboratories, catering to employees with varying levels of graph literacy.
Visualizing different types of data
Delving into graph types, I identified the most suitable options for different data sets. Bar graphs were chosen for presenting independent numerical data, while line graphs proved optimal for illustrating trends over time. Additionally, pie charts were selected for facilitating data comparison.
Simplicity in Visualization
While considering visually appealing alternatives such as mosaic charts and heatmaps, I prioritized simplicity. Complex visualizations can pose challenges for users, potentially impeding the extraction of meaningful insights. Therefore, I adhered to straightforward graph types to enhance user comprehension and usability.
This case study highlights my strategic approach as a UI/UX designer in addressing the unique requirements of UNMC’s dashboard application, prioritizing user experience and data clarity throughout the design process.
Project scope
Prototypes for a dashboard desktop app
My role
UX Design, UI Design
UX Criteria
- Clear and distinct separation of data from various organizational departments.
- Prioritization of data layout for optimal presentation.
- Ensuring readability and comprehensibility of data through visual reinforcement.
- Facilitating easy access to different types of data.
- Intuitive user interaction with graphs and charts.
- Designing a simple and easy-to-navigate dashboard interface for enhanced usability.

DATA STRUCTURE ORGANIZATION
A I reorganized the data by separating complex information and consolidating comparable data sets. This approach improved clarity and ease of organizing data in modules